

TRACE Residential: Candidate-Then-Verify Wall Recovery from Vector Construction Drawings
1. Introduction
Architectural floor plans are unusually information-dense technical documents. A single sheet can contain wall faces, room labels, dimensions, leader lines, structural grids, door swings, cabinetry, equipment, hatch patterns, schedules, revision clouds and title-block geometry. The elements most relevant to estimating are embedded in a field of visually plausible distractors: a line can be long, straight, dark and architecturally meaningful without being a wall.
The distinction matters because wall length is a multiplier for downstream quantities. Stud counts, top and bottom plate, sheathing, insulation, gypsum board, cladding, blocking and several finish quantities are derived directly or indirectly from recovered wall geometry. A system can produce internally consistent arithmetic while remaining materially wrong if the geometric basis is wrong. Earlier Foreman AI work focused on how such systems should be measured and showed that reported linear footage alone correlates weakly with correct wall recovery, while different recovery engines fail on different sheets [12].
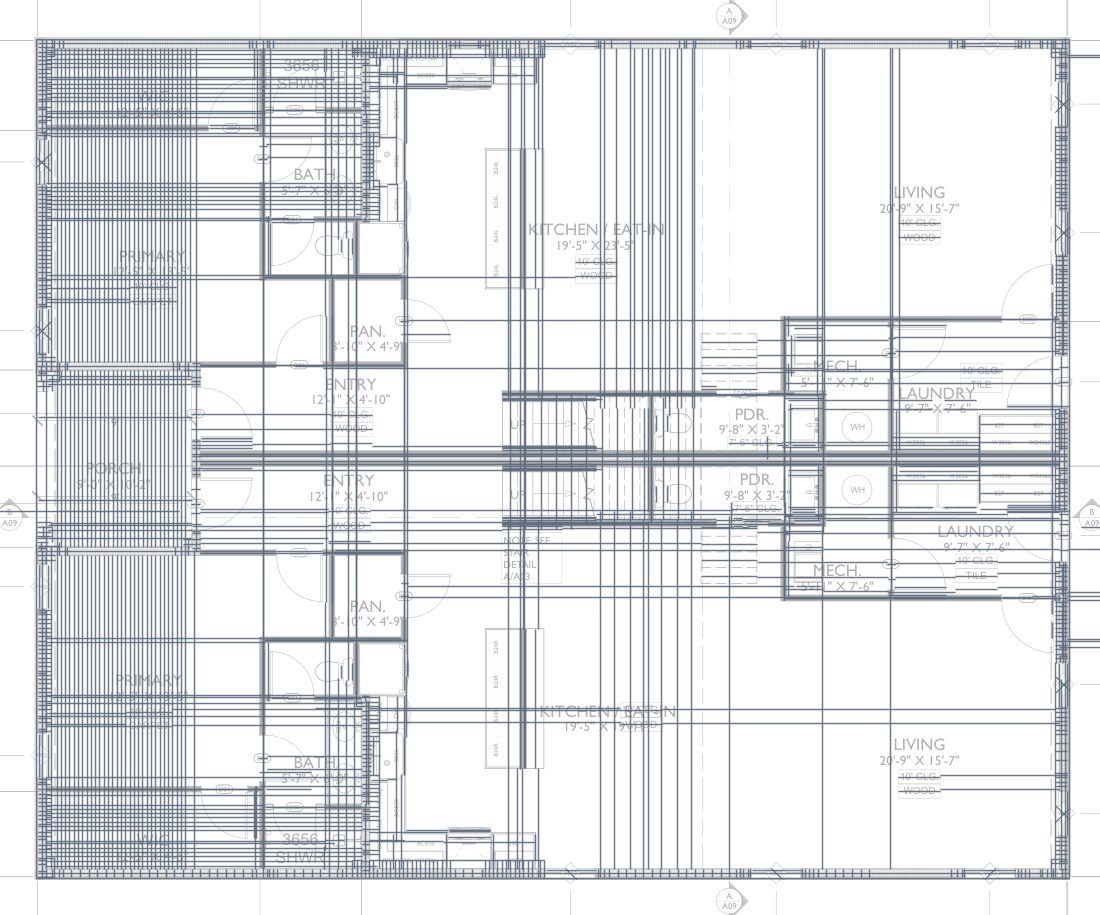
Much of the floor-plan literature begins from raster images and predicts segmentation masks, corners, edges, room polygons or full planar graphs [2, 3, 7, 8, 9]. Those formulations fit when the only input is an image. Construction PDFs, however, often retain exact vector primitives. This creates a different design opportunity: instead of asking a neural network to generate coordinates, deterministic geometry can generate candidate coordinates and learned models can answer the narrower question, which candidates are walls, over what span, and which overlapping candidates describe the same physical wall?
This paper studies that formulation. The resulting system is TRACE, for Tokenized Representation of Architectural CAD Elements: the drawing's own CAD elements become the tokens the models reason over, and every output coordinate is inherited from a token. The contributions are:
- a candidate-then-verify architecture in which every output coordinate comes from PDF geometry rather than raster quantization;
- a hash-pinned evaluation lineage that separates development and external-evaluation populations and audits both for leakage;
- a same-ruler comparison with the previous production tracer (V1) using identical sheets, truth, tolerance, aggregation and scorer; and
- failure localization showing that several hard cases already contain the correct wall geometry in the token pool, with the dominant loss at learned acceptance or merge rather than extraction.
The paper does not claim state of the art. Published systems use different datasets, tasks and metrics, and the present corpus is proprietary. The objective is to report a reproducible engineering result on real construction drawings, together with the limitations that determine what the result does and does not establish. A companion report adapts TRACE to commercial plans [14].
2. Related work
Automatic floor-plan interpretation spans document analysis, semantic segmentation, vectorization, inverse CAD and structured reconstruction. Liu et al. combined learned junction prediction with integer programming to reconstruct vector floor plans from raster images [2]. CubiCasa5K provided 5,000 densely annotated floor-plan images and a multi-task convolutional baseline for room and symbol parsing [3]. Floor-SP formulated floor-plan recovery as room-wise structured optimization [4], HEAT learned holistic edge classification for planar-graph reconstruction [7], and RoomFormer formulated reconstruction as direct polygon prediction with two-level Transformer queries [9].
Construction-grade blueprints differ from simplified real-estate floor plans in resolution, drafting complexity and density. Song et al. addressed high-definition blueprint vectorization with segmentation, topology reasoning, learned refinement and heuristic simplification on 200 production blueprints [8]. Recent AEC work has explored graph-augmented floor-plan segmentation [10] and semi-supervised wall segmentation with limited labels [11]. These systems reinforce two themes: walls are a structured geometric object rather than merely a pixel class, and labeled data remains a practical constraint.
TRACE differs in three ways. Its input is a vector PDF rather than a raster, so geometric proposals are exact in document coordinates. Its learned networks do not emit final wall coordinates; they verify, trim and de-duplicate tokens produced from the PDF. And the evaluation reports takeoff-oriented quantities such as total wall-footage error alongside a positional score.
3. Problem definition and metric
3.1 Input and output
The system receives a vector PDF page and a physical scale expressed as PDF points per foot (ppf). Scale is an input to the evaluated core; the 0.9117 result is not a scale-detection result. The output is a set of vector wall runs in PDF coordinates. The evaluation here is geometry-level and class-agnostic; later production stages assign exterior/interior class and support room and opening workflows.
The reference traces contain wall polylines with four labels: exterior, interior, bearing and open. Bearing is treated as wall geometry in the core benchmark. Open spans represent wall continuation through door and window gaps in the gross convention; a separate net view removes them.
3.2 Length-weighted positional score
The primary metric follows the positional-accuracy idea of Goodchild and Hunter [1]. Prediction and reference linework are sampled every 1.5 PDF points. For tolerance d = 1 physical foot, precision is the length fraction of prediction samples within d of any reference segment, and recall reverses the roles:
R = L(G within d of Ĝ) / L(G)
F1 = 2PR / (P + R)
F1, precision and recall are computed per sheet and macro-averaged. The metric is useful but incomplete: it is not one-to-one, direction-aware or class-aware, so duplicated parallel predictions can stay close enough to reference geometry to receive credit. For estimating, the paper therefore reports aggregate linear-footage over/under and, where available, absolute footage error alongside F1.
4. Evaluation data and leakage audit
4.1 Reference set
All sheets are single-page vector floor plans with reference wall traces, drawn from Foreman AI's corpus of nearly 98,000 real engineered plans (about 3.6 million pages). The development set contains 20 vector floor-plan sheets at several drawing scales, including pages rotated 90° and 270° (Table 3). The training data is dominated by residential sheets drawn at 1/4 in. = 1 ft; smaller scales, particularly 1/8 in., are much less common, an imbalance that becomes relevant in Sec. 9.
4.2 Development-set leakage and group overlap
The development set is not an independent test set. It was used to select the RoomNet checkpoint and threshold, the QuantityNet checkpoint and post-processing settings. A later content audit also found one development PDF that renders pixel-identically to a training PDF despite different file bytes and different reference traces. Removing that sheet changes TRACE F1 from 0.9117 to 0.9089. A second development page belongs to the same project as a training page; removing both leaves 18 sheets and F1 0.9070.
Architect and template overlap is also material. Ten of the 20 development sheets belong to architect groups represented in training and ten do not. TRACE scores 0.9447 on the architect-seen half and 0.8787 on the unseen half; V1 scores 0.8004 and 0.7544 on the same groups. With n = 10 per subgroup these values are a diagnostic, not a population estimate.
4.3 External evaluation set
A separate eight-sheet external set represents seven projects. No external PDF hash matches a training or development sheet, and the external pages were not used to select QuantityNet. An earlier RoomNet-only model had, however, been scored on these pages before QuantityNet was frozen, and later cleanup work also reviewed them. We therefore call this an external evaluation set, not a pristine blind test.
5. TRACE architecture
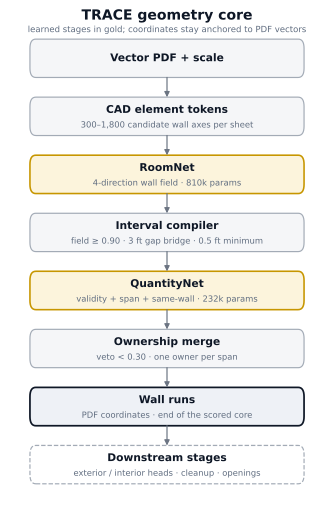
TRACE is not an end-to-end raster wall segmenter. It is a sequential pipeline that combines deterministic PDF geometry with learned verification (Fig. 2, Table 5).
5.1 Token extraction
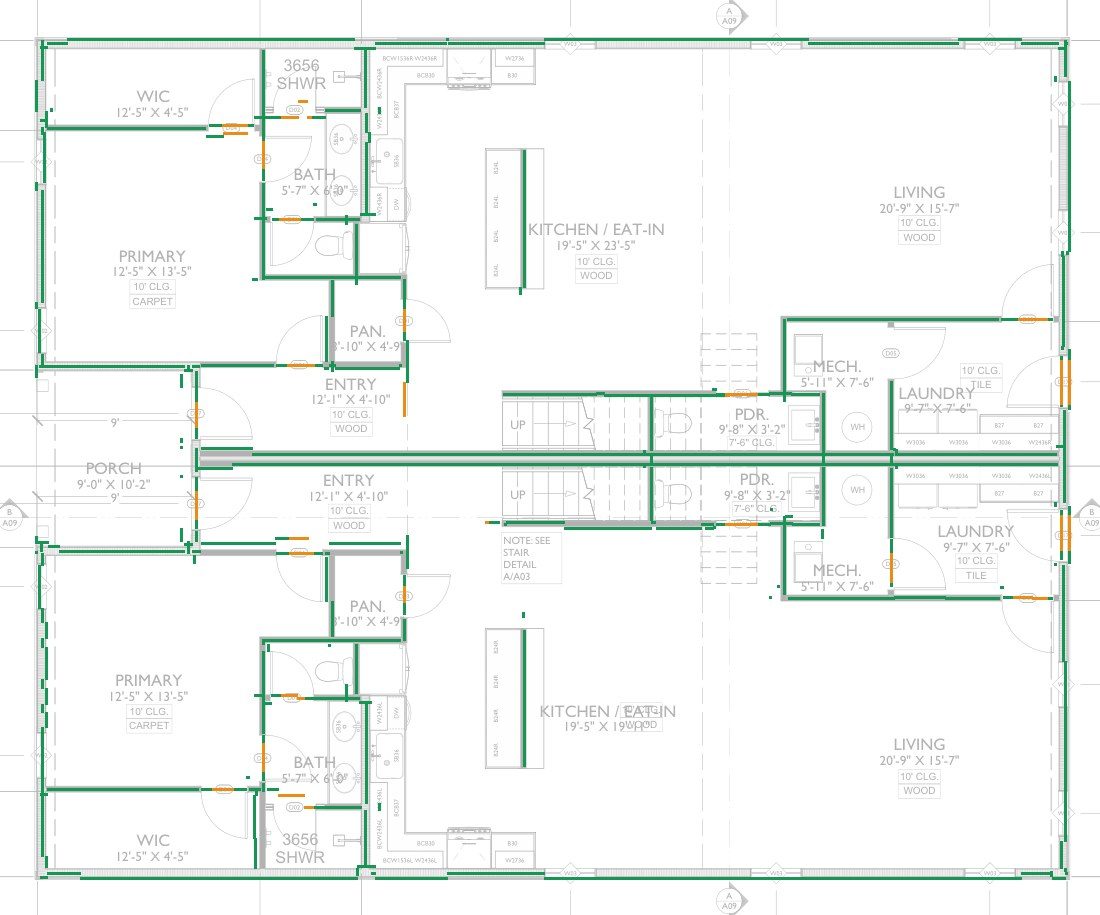
The PDF is parsed into a bounded set of candidate wall axes, the tokens. Token sources include parallel stroke pairs, merged parallel faces across hatching, filled-region boundaries, clipped-fill boundaries, mixed fill/stroke pairs, stroke-envelope boundaries, junction continuations and endpoint continuations. The adaptive budget is about 300–1,800 tokens per sheet. Final coordinates are inherited from these document-space tokens: learned models determine acceptance and span, never coordinates.
5.2 RoomNet directional field
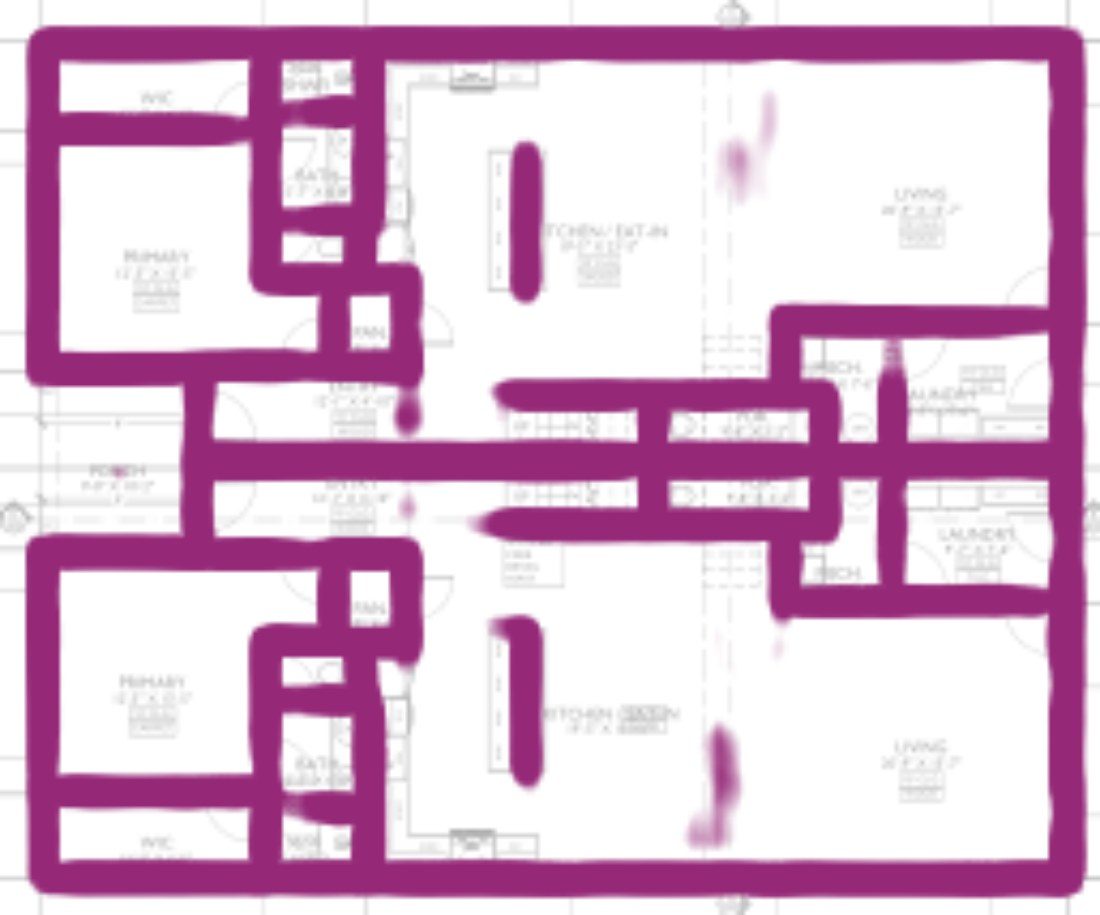
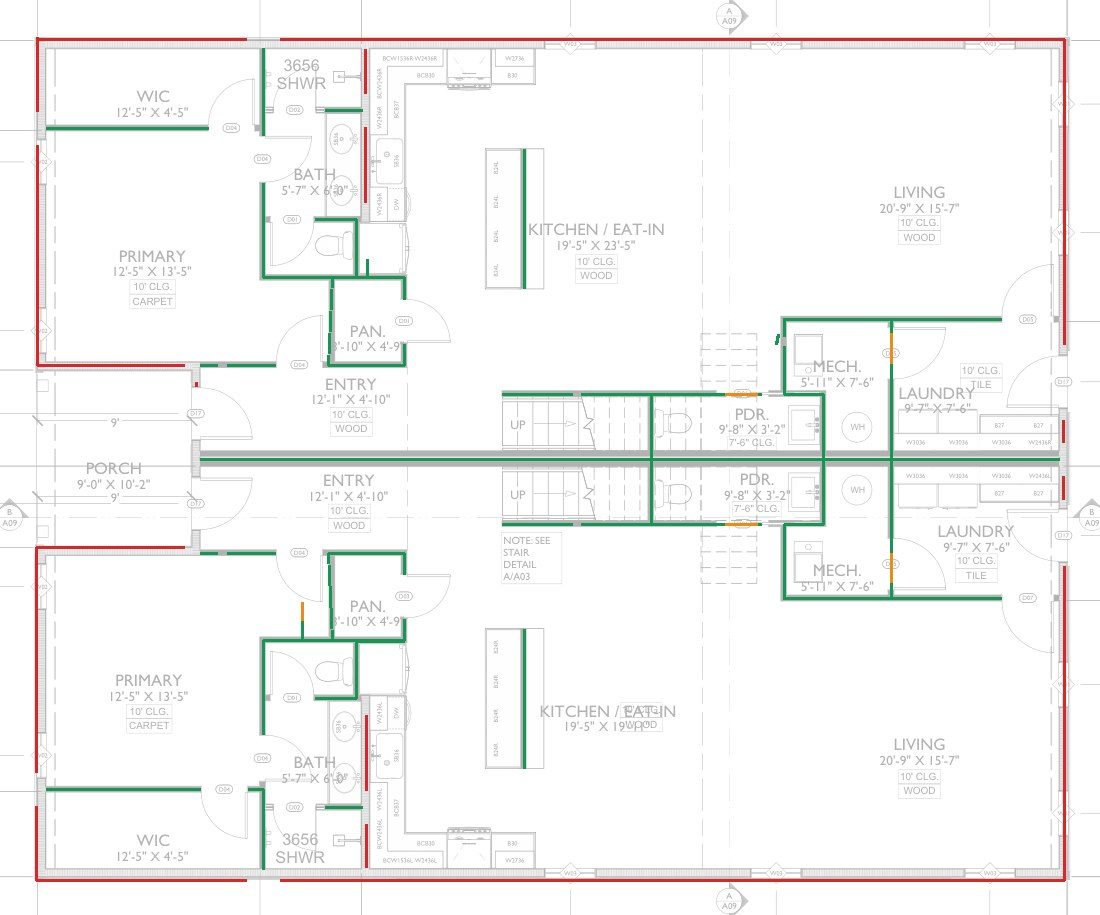
RoomNet is a compact five-stage U-Net [5] with widths 12–24–48–96–128 and 810,096 trainable parameters. The page is rendered in grayscale at four pixels per physical foot, and the network emits four wall-probability channels for orientation bins centered at 0°, 45°, 90° and 135°. At inference the channel aligned with a token is sampled along it. A median filter of width three smooths the samples; samples at or above 0.90 count as wall, internal gaps up to three feet are bridged, and intervals shorter than 0.5 ft are removed. This compiler converts a dense raster field into one-dimensional accepted spans on exact vector tokens (Fig. 1b).
5.3 QuantityNet
QuantityNet adds 231,588 trainable parameters. For each token it consumes a 5-channel, 17-by-48 profile at eight pixels per foot (grayscale plus the four RoomNet channels) and 24 numeric features. Its convolutional encoder feeds heads for token validity and normalized start/end span. A pair network receives the symmetric combination of two token embeddings plus eight geometric pair features and predicts whether overlapping tokens belong to the same physical wall. The selected configuration applies a validity veto at 0.30, clips intervals to predicted endpoints, and uses same-wall affinity with a pair threshold of 0.05 to assign each shared span a single owner. The ownership merge suppresses the parallel-face double counting common in thick, hollow and hatched wall representations.
5.4 Downstream stages
Two small MLP heads classify exterior and interior wall geometry, followed by rule-based perimeter and topology passes. On geometry already matched to truth, length-weighted exterior/interior accuracy is 0.9505 on development sheets and 0.9156 on the external set. A separate ResNet18-based detector [6] handles door and window instances. These stages ship in the runtime but do not contribute to the class-agnostic 0.9117 score.
6. Training and model selection
6.1 RoomNet
RoomNet was trained from random initialization on page crops rendered at four pixels per foot, with reference walls rasterized into the four direction channels. Augmentation consists of 90-degree rotations, horizontal flips with direction-channel remapping and multiplicative ink-gain variation; there is no scale or line-weight augmentation. The loss combines class-weighted binary cross-entropy with soft Dice and is optimized with AdamW under a warm-up and cosine schedule.
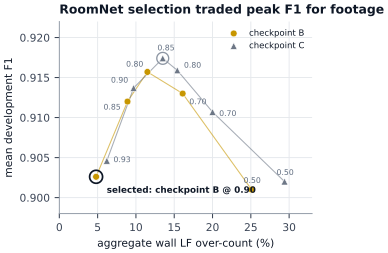
Twelve combinations of three checkpoints (A, B and C, in training order) and acceptance thresholds were scored on the development set (Table 2, Fig. 3). The numerically highest F1 was 0.9174 at checkpoint C and threshold 0.85, but that setting over-counted aggregate footage by 13.5%. Checkpoint B at threshold 0.90 was selected at lower F1 (0.9026) because its aggregate footage error was +4.8% while precision stayed high.
| Checkpoint | Threshold | Mean F1 | P | R | LF over |
|---|---|---|---|---|---|
| A | 0.50 | 0.8221 | 0.7177 | 0.9767 | +69.0% |
| B | 0.50 | 0.9010 | 0.8697 | 0.9393 | +25.1% |
| B | 0.70 | 0.9130 | 0.9060 | 0.9289 | +16.1% |
| B | 0.80 | 0.9157 | 0.9201 | 0.9208 | +11.5% |
| B | 0.85 | 0.9120 | 0.9268 | 0.9083 | +8.9% |
| B | 0.90 | 0.9026 | 0.9324 | 0.8915 | +4.8% |
| C | 0.50 | 0.9020 | 0.8604 | 0.9524 | +29.4% |
| C | 0.70 | 0.9107 | 0.8926 | 0.9378 | +20.0% |
| C | 0.80 | 0.9159 | 0.9093 | 0.9325 | +15.4% |
| C | 0.85 | 0.9174 | 0.9149 | 0.9297 | +13.5% |
| C | 0.90 | 0.9137 | 0.9226 | 0.9180 | +9.7% |
| C | 0.93 | 0.9046 | 0.9264 | 0.9014 | +6.2% |
6.2 QuantityNet
QuantityNet was trained from scratch with RoomNet frozen, sampling token examples together with balanced positive and negative same-wall pairs. The loss combines length-weighted validity cross-entropy, span regression weighted by the matched portion of each token, and overlap-weighted same-wall cross-entropy, optimized with AdamW and cosine decay. About 25 QuantityNet and merge variants were scored on the same development sheets; one checkpoint with validity veto 0.30 and ownership merge was frozen. The two geometry-critical models together hold about 1.04 million parameters. Data curation, token engineering, evaluation and failure analysis dominate the development cost, not training.
| Component | Role | Parameters |
|---|---|---|
| Token extraction | candidate wall axes from PDF vectors | deterministic |
| RoomNet | 4-direction wall field, 4 px/ft | 810,096 |
| Interval compiler | field ≥ 0.90, 3 ft bridge, 0.5 ft minimum | deterministic |
| QuantityNet | validity, span, same-wall affinity | 231,588 |
| Ownership merge | veto 0.30, pair threshold 0.05 | deterministic |
| Exterior/interior heads | base MLP + context MLP (downstream) | small MLPs |
| Opening detector | ResNet18 instances (downstream) | separate |
7. Experimental design
7.1 V1 baseline
V1 is the frozen previous production wall tracer, captured by our internal benchmark harness on 2026-08-30. Its outputs combine route-dependent learned and heuristic/vector components. Historical V1 scores cannot be subtracted directly from TRACE because earlier reports used different sheet populations, opening conventions, pooling methods and distance discretizations. The widely repeated “76% to 91%” summary is therefore replaced here with a same-ruler re-score.
7.2 Same-ruler re-score
Frozen V1 and TRACE predictions are scored against the same reference JSON with a byte copy of the TRACE scorer (SHA-256 prefix 41a06055), identical 1-ft tolerance and macro per-sheet aggregation, against both gross and net truth. The gross view includes opening spans and matches TRACE's output contract; the net view removes them and is closer to V1's opening-cut contract. No model was retrained for this comparison. As a secondary uncertainty summary we compute a paired nonparametric bootstrap of the 20 per-sheet gross-F1 differences (200,000 resamples, seed 1701) and a two-sided exact sign test on the 17–3 win count. These statistics describe variation across development sheets; they do not correct the selection bias of Sec. 4.2.
8. Results
8.1 Primary development comparison
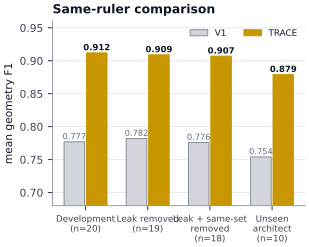
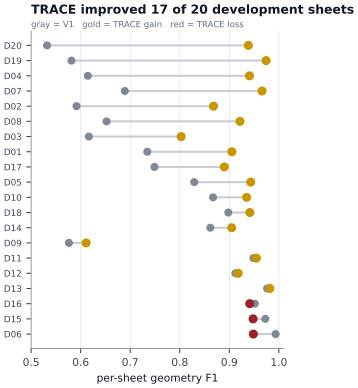
On the 20-sheet development set V1 scores 0.7774 mean gross F1 and TRACE 0.9117, a mean paired increase of 0.1343 (bootstrap 95% interval [0.074, 0.198]). TRACE is better on 17 of 20 sheets (exact two-sided sign test p = 0.0026). Precision rises from 0.803 to 0.919 and recall from 0.776 to 0.912; aggregate wall footage moves from −3.4% for V1 to +5.5% for TRACE (Table 1, Fig. 4). The pixel-identical duplicate does not explain the result: removing it reduces TRACE to 0.9089 and the difference to +0.127; removing the same-project page as well leaves 0.9070 and +0.131. Figure 5 shows every sheet; Table 3 lists them.
| Population | n | V1 | TRACE | Δ |
|---|---|---|---|---|
| Development, gross | 20 | 0.777 | 0.912 | +0.134 |
| Development, net | 20 | 0.755 | 0.885 | +0.131 |
| Leak removed, gross | 19 | 0.782 | 0.909 | +0.127 |
| Leak + same-project removed | 18 | 0.776 | 0.907 | +0.131 |
| Architect unseen in training | 10 | 0.754 | 0.879 | +0.124 |
8.2 Generalization diagnostics
The architect-group split is useful but small. TRACE scores 0.9447 on the ten development sheets whose architect group appears in training and 0.8787 on the ten that do not; V1 shows the same direction (0.8004 and 0.7544), so some of the gap is plausibly drawing difficulty rather than memorization alone. Because the split was discovered post hoc with ten sheets per group, it is not a formal domain-generalization benchmark.
The eight external sheets yield mean gross F1 0.8874, precision 0.9513 and recall 0.8453. The positional score is encouraging, but total recovered wall footage is 4,834.8 LF against 6,737.5 LF of truth (−28.2%), and only two of eight pages lie within ±5% footage. Removing the single worst external sheet raises the remaining F1 to about 0.924 and removes most of the under-count, so the small set is dominated by one severe outlier (Sec. 9.1).
8.3 Where TRACE improves
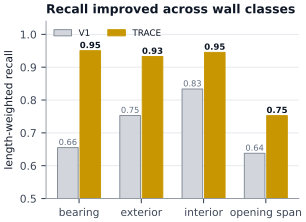
TRACE's gain is predominantly recall without a corresponding precision collapse. On the development sheets bearing-wall recall rises from 0.655 to 0.950, exterior from 0.753 to 0.933 and interior from 0.834 to 0.945; opening-span recall rises more modestly, from 0.638 to 0.753 (Fig. 6). The same slices show gains on rotated and non-axis-aligned geometry: recall on 270° pages rises from 0.639 to 0.943, on walls at 40–50° from 0.701 to 0.866, and on walls at least 20 ft long from 0.722 to 0.914 (Table 4). These subsets are small and are diagnostics rather than independent significance tests.
| Development slice | Truth LF | V1 recall | TRACE recall |
|---|---|---|---|
| Walls at 40–50° | 273 | 0.701 | 0.866 |
| Bearing walls | 264 | 0.655 | 0.950 |
| Exterior walls | 4,900 | 0.753 | 0.933 |
| Interior walls | 4,076 | 0.834 | 0.945 |
| Opening spans | 1,312 | 0.638 | 0.752 |
| Walls < 3 ft | 1,196 | 0.785 | 0.884 |
| Walls ≥ 20 ft | 3,215 | 0.722 | 0.914 |
| 3/16" sheets | 2,093 | 0.762 | 0.928 |
| 1/8" sheets | 817 | 0.804 | 0.962 |
| Pages rotated 270° | 1,398 | 0.639 | 0.943 |
| Pages rotated 90° | 1,366 | 0.850 | 0.937 |
8.4 Positional F1 versus material footage
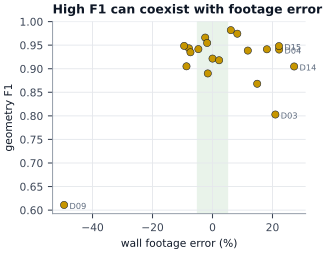
The strongest reason not to collapse the evaluation into one F1 number is the remaining footage error. Several development sheets score above 0.90 F1 while over-counting wall length by more than 20%: D04 scores 0.941 F1 at +22.2%, and D15 scores 0.948 at +22.2% (Fig. 7). The positional metric considers duplicated nearby lines correct even when they would double-count material.
| Sheet | Scale | Rotation | V1 F1 | TRACE F1 | TRACE P | TRACE R | Footage error |
|---|---|---|---|---|---|---|---|
| D01 | 1/4" | 0° | 0.734 | 0.905 | 0.942 | 0.871 | -8.7% |
| D02 | 1/4" | 0° | 0.592 | 0.868 | 0.826 | 0.915 | +14.9% |
| D03 | 3/16" | 0° | 0.617 | 0.803 | 0.751 | 0.862 | +21.0% |
| D04 | 1/4" | 0° | 0.615 | 0.941 | 0.897 | 0.989 | +22.2% |
| D05 | 1/4" | 270° | 0.829 | 0.943 | 0.983 | 0.907 | -7.8% |
| D06 | 1/4" | 0° | 0.993 | 0.948 | 0.972 | 0.926 | -9.4% |
| D07 | 1/4" | 0° | 0.689 | 0.966 | 1.000 | 0.935 | -2.4% |
| D08 | 3/16" | 0° | 0.652 | 0.922 | 0.915 | 0.928 | +0.0% |
| D09 | 1/4" | 0° | 0.576 | 0.611 | 0.843 | 0.479 | -49.5% |
| D10 | 1/4" | 0° | 0.867 | 0.935 | 0.964 | 0.908 | -7.4% |
| D11 | 1/4" | 0° | 0.949 | 0.955 | 0.984 | 0.927 | -1.8% |
| D12 | 1/4" | 0° | 0.912 | 0.918 | 0.914 | 0.922 | +2.2% |
| D13 | 1/4" | 90° | 0.976 | 0.982 | 0.972 | 0.992 | +6.1% |
| D14 | 1/8" | 0° | 0.862 | 0.905 | 0.854 | 0.962 | +27.2% |
| D15 | 3/16" | 0° | 0.973 | 0.948 | 0.907 | 0.993 | +22.2% |
| D16 | 1/4" | 90° | 0.952 | 0.941 | 0.894 | 0.994 | +18.1% |
| D17 | 1/4" | 90° | 0.749 | 0.890 | 0.927 | 0.856 | -1.6% |
| D18 | 1/4" | 0° | 0.898 | 0.942 | 0.966 | 0.918 | -4.7% |
| D19 | 1/4" | 270° | 0.581 | 0.974 | 0.960 | 0.989 | +8.3% |
| D20 | 1/4" | 270° | 0.532 | 0.938 | 0.910 | 0.969 | +11.8% |
9. Failure analysis
9.1 A 1/8-inch external failure localizes the bottleneck
The hardest external page is drawn at 1/8 in. = 1 ft (9 ppf). TRACE predicts 1,149.8 LF against 2,640.3 LF of truth, with precision 0.937, recall 0.474 and F1 0.630. The failure is not primarily proposal coverage: raw extraction coverage is 1.000, post-merge coverage 1.000 and ranked/capped token coverage 0.962. After RoomNet-based acceptance, coverage falls to 0.394 and stays at 0.393 after finalization (Fig. 8).
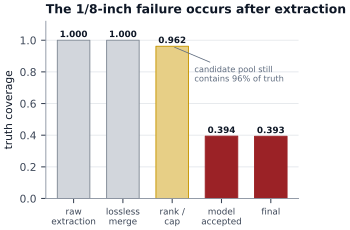
1/8-inch sheets are a small minority of RoomNet's training data, and its training used no scale augmentation. Later production experiments showed that a second-scale pass can improve recall on this class, but those were not part of the evaluated model. The single 9-ppf development page (D14) performs well, so scale alone is not a sufficient explanation; the evidence points to an interaction among scale, drafting convention and training distribution rather than a universal 1/8-inch rule.
9.2 In-distribution classification failure
A 1/4-inch development sheet, D09, scores only 0.611 F1 and 0.479 recall even though its token-recall ceiling is 0.888. V1 is also poor on this page (0.576 F1), suggesting a genuinely difficult drawing style. The token evidence again narrows the error to acceptance rather than absence of vector wall proposals.
9.3 Duplicate-face and merge errors
The opposite failure mode is over-recovery. Thick, hatched or compound wall assemblies can generate several plausible parallel tokens. A separate de-duplication audit found substantial overlap among oracle-selected token footage, and Fig. 7 shows pages above +20% wall length despite high F1. This is partly an algorithmic merge problem and partly a benchmark problem: a many-to-one tolerance metric is inherently permissive toward duplicate nearby predictions.
9.4 Exterior/interior and openings
After downstream class heads and topology passes, exterior/interior accuracy on matched geometry is 0.9505 on the development set and 0.9156 on the external set, where errors are dominated by interior wall length labelled exterior on unfamiliar drawings. Opening treatment remains less mature. The geometry core traces through door and window spans; against net truth with openings removed, development F1 falls from 0.9117 to 0.8855 and aggregate footage rises to +20.4%. A fully validated net, billable wall takeoff remains future work.
10. Discussion
The central engineering result is not simply that a small neural model improves a wall benchmark. It is that learned recognition can be inserted at the verification layer while geometry stays deterministic. This preserves exact PDF coordinates, avoids a raster-to-vector conversion stage, and lets learning focus on local and relational evidence: whether a token looks like wall, which part of it is valid, and which parallel tokens are duplicates.
That division of labor suits construction documents. Vector extraction is strong at producing geometrically plausible hypotheses but weak at semantics; raster learning is strong at local appearance and context but blurs coordinates or needs a separate vectorization stage. TRACE combines them. The improvement from 0.777 to 0.912 on the same 20 development pages is large relative to the model size, and it persists when the known duplicate and same-project page are removed.
The external results show why a geometry benchmark must be paired with a measurement benchmark. A system can be spatially close to most reference walls and still under-count the total quantity materially. For estimating, the acceptable error criterion is not merely that the predicted line lies within one foot of a wall, but that the final billable run represents the right physical wall exactly once, at the right scale and class, with openings handled according to the quantity contract.
A second implication is methodological. The development set was used correctly as a development set but was later described informally as “held out.” Repeated selection across thresholds, checkpoints and merge policies produces optimistic estimates even when the development images are excluded from gradient updates, and content-level duplicate detection is necessary: file hashes alone did not catch a pixel-identical train/development pair.
11. Limitations and threats to validity
- Development-set selection. The 20-sheet 0.9117 result was used to select RoomNet, QuantityNet and post-processing settings. It is not an independent test estimate.
- Leakage. One development sheet is pixel-identical to a training sheet, and another shares a project with training. Cleaned results are reported, but the split was not designed as building- or firm-disjoint.
- Small external sample. The eight external sheets represent only seven projects. They were not used to select QuantityNet, but an earlier RoomNet-only model had been scored on them.
- Reference noise. Reference traces are themselves imperfect: two independent references of the leaked duplicate drawing differ by about 15% in total wall footage, and reference reproducibility has not been measured at useful scale.
- Metric permissiveness. The 1-ft buffer metric is not one-to-one, direction-aware or class-aware, so parallel duplicates can be rewarded. Footage error is reported separately; future work should add direction constraints and one-to-one matching.
- Scale and domain coverage. Residential 1/4-inch plans dominate training; commercial, multi-family and 1/8-inch drawings are under-represented. Report 2 addresses commercial plans [14].
- RoomNet reproducibility. The selected checkpoint is preserved, but RoomNet's exact launch configuration and random seed are not.
- Baseline snapshot. V1 is a frozen production snapshot from 2026-08-30 rather than a family of historical variants.
12. Reproducibility and artifact lineage
Inference and evaluation are reproducible from frozen artifacts. The selected RoomNet checkpoint begins SHA-256 8e06a59fff839ab1, the selected QuantityNet checkpoint begins ae18a188e4f3086c, and the same-ruler scorer begins 41a0605555583d8f; full hashes are retained in the artifact index. Re-running the frozen TRACE predictions through that scorer reproduced the historical gross development result 0.911720524 exactly and reproduced the 0.8855 net result. Training records for both models are retained, but RoomNet's exact launch configuration and seed remain unresolved. These details are disclosed because a small reproducibility gap can matter when comparisons are on the order of one F1 point.
13. Conclusion
A compact learned verifier over deterministic PDF geometry substantially improves wall recovery. On an identical 20-sheet development population and scorer, TRACE raises mean geometry F1 from 0.7774 to 0.9117, improves 17 of 20 pages, and increases recall across bearing, exterior, interior, rotated, long and angled wall subsets. The result remains about 0.91 after removing known leakage, while the architect-unseen half and the external evaluation land near 0.88–0.89.
The remaining failures are equally important. External wall footage is under-counted, a 1/8-inch sheet loses most of its truth only after learned acceptance, and some high-F1 pages still over-count material by more than 20%. These findings argue for an evaluation standard that treats positional geometry, one-to-one wall identity, scale, class and final linear footage as separate but jointly necessary criteria. The next decisive experiment is not another training run but a new, audited, building-disjoint test set scored once with frozen V1 and TRACE under a one-to-one, direction-aware metric plus direct footage error.
Data availability
The plan sheets come from Foreman AI's proprietary corpus and are not redistributed; sheets are identified by neutral IDs. Frozen model hashes, de-identified per-sheet metrics, scorer identity, split metadata and aggregate results are retained by Foreman AI Research.
Competing interests
Kyle Rossignol is the founder of Foreman AI LLC, which develops commercial construction-estimating software incorporating the wall-recovery technology described here. This manuscript reports internal research and should be interpreted with that relationship disclosed.
Funding
The work was conducted as internal research and development by Foreman AI LLC. No external research funding is reported in the experiment record.
Author contributions
K.R. conceived the construction-measurement problem, developed the Foreman AI system and research program, and prepared the underlying experimental record. The figures and this edition of the manuscript were prepared with Claude (Anthropic), an AI model, under K.R.'s direction.
References
- M. F. Goodchild and G. J. Hunter, “A simple positional accuracy measure for linear features,” International Journal of Geographical Information Science, vol. 11, no. 3, pp. 299–306, 1997. doi:10.1080/136588197242419.
- C. Liu, J. Wu, P. Kohli, and Y. Furukawa, “Raster-To-Vector: Revisiting Floorplan Transformation,” in Proc. IEEE International Conference on Computer Vision (ICCV), pp. 2195–2203, 2017.
- A. Kalervo, J. Ylioinas, M. Häikiö, A. Karhu, and J. Kannala, “CubiCasa5K: A Dataset and an Improved Multi-Task Model for Floorplan Image Analysis,” arXiv:1904.01920, 2019.
- J. Chen, C. Liu, J. Wu, and Y. Furukawa, “Floor-SP: Inverse CAD for Floorplans by Sequential Room-Wise Shortest Path,” in Proc. IEEE/CVF International Conference on Computer Vision (ICCV), pp. 2661–2670, 2019.
- O. Ronneberger, P. Fischer, and T. Brox, “U-Net: Convolutional Networks for Biomedical Image Segmentation,” in Medical Image Computing and Computer-Assisted Intervention (MICCAI), pp. 234–241, 2015.
- K. He, X. Zhang, S. Ren, and J. Sun, “Deep Residual Learning for Image Recognition,” in Proc. IEEE Conference on Computer Vision and Pattern Recognition (CVPR), pp. 770–778, 2016.
- J. Chen, Y. Qian, and Y. Furukawa, “HEAT: Holistic Edge Attention Transformer for Structured Reconstruction,” in Proc. IEEE/CVF Conference on Computer Vision and Pattern Recognition (CVPR), pp. 3866–3875, 2022.
- W. Song, M. M. Abyaneh, M. A. A. Shabani, and Y. Furukawa, “Vectorizing Building Blueprints,” in Proc. Asian Conference on Computer Vision (ACCV), pp. 1044–1059, 2022.
- Y. Yue, T. Kontogianni, K. Schindler, and F. Engelmann, “Connecting the Dots: Floorplan Reconstruction Using Two-Level Queries,” in Proc. IEEE/CVF Conference on Computer Vision and Pattern Recognition (CVPR), pp. 845–854, 2023.
- J. Knechtel, P. Rottmann, J.-H. Haunert, and Y. Dehbi, “Semantic floorplan segmentation using self-constructing graph networks,” Automation in Construction, vol. 166, 105649, 2024. doi:10.1016/j.autcon.2024.105649.
- H. Xie, X. Ma, Q. Mei, and Y. H. Chui, “A semi-supervised approach for building wall layout segmentation based on transformers and limited data,” Computer-Aided Civil and Infrastructure Engineering, vol. 40, pp. 1295–1313, 2025. doi:10.1111/mice.13397.
- K. Rossignol, “Measurement Practice for Automated Wall Recovery from Architectural Construction Drawings,” Foreman AI Research, Colorado, USA, technical report, Aug. 2026.
- K. Rossignol, “AI-Augmented Plan Review: Practical Lessons from the Field,” PM World Journal, vol. XV, no. I, Jan. 2026.
- K. Rossignol, “TRACE Commercial: Adapting Wall Recovery to Commercial Floor Plans,” Foreman AI Research, TRACE Series Report 2, Colorado, USA, Sep. 2026.