

TRACE-Roof: A Pilot for Recovering Roof Area, Roof Lines and Roof Planes from Architectural Roof Plans
1. Introduction
A roofing takeoff is three measurements multiplied out. Plan area times a pitch factor gives sloped area, which sets decking, underlayment, shingles, tear-off and labor squares. The roof perimeter sets drip edge, fascia and soffit, and its eave share sets gutters, starter strip and the eave course of ice-and-water membrane. The lines between planes set ridge and hip cap, ridge vent and valley metal. None of the three can be read reliably from a floor plan: overhangs push the roof outside the walls, and ridges, hips and valleys exist only on the roof plan.
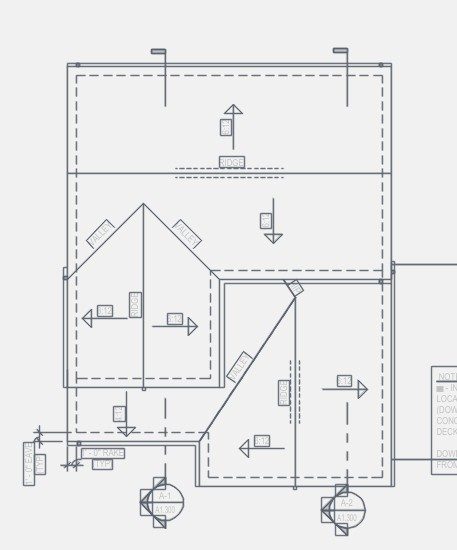
TRACE recovers walls by treating the vector CAD elements of a PDF as tokens and using compact learned models only to decide which tokens are walls [1]; a companion report adapted it to commercial plans [2]. Roof plans invite the same approach. The roof outline, the ridge and the hips are already drawn as vectors, among dashed wall lines, pitch arrows, dimension strings, section marks and notes (Fig. 1a). A learned model can say roughly where the roof and its lines are; the drawing itself says exactly where.
The rule-based alternative did not survive real drawings. Our earlier roof module read roof plans with drafting rules: a roof title of a minimum size, pitch callouts in text, recognisable line work. Audited through the production code path on 277 plan sets, it returned nothing on 234 (84.0%): 107 failed on pitch text drawn in a CAD font that does not extract as text, 66 had no qualifying title, 29 never activated, 18 found zero planes and 14 failed otherwise. Of the 43 that produced output, 37 found six planes or fewer.
Most published floor-plan work starts from raster images [5, 6]; blueprint vectorization has been attempted on high-resolution drawings [7], and roof structure is usually reconstructed from aerial data rather than drawings [8]. TRACE-Roof stays in the PDF's own coordinates. This pilot contributes:
- a five-class roof field model whose ambiguous edge distinctions are merged in training and restored afterwards by roof topology;
- geometry stages that turn the field into a snapped, right-angled roof outline and closed roof planes in exact PDF coordinates;
- a held-out set of 14 roof plans recorded plane by plane, with area, line and plane-level metrics; and
- three negative results: seven-class edge prediction, one-sided hatch augmentation, and fine-tuning the outline model for roof lines.
2. The TRACE-Roof model
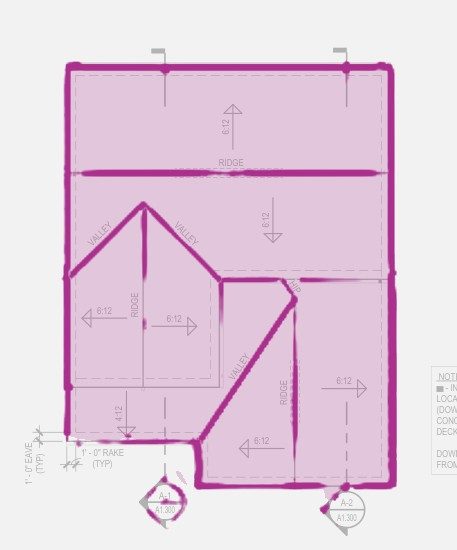
The design follows the wall model: learned recognition proposes, the drawing disposes. Every coordinate TRACE-Roof outputs is moved onto a line drawn in the PDF wherever such a line exists (Fig. 2).
Field model. The network is TRACE's RoomNet body, a five-level U-Net [3] with encoder widths 12–24–48–96–128, given a five-class head (810,135 parameters): background, roof plane, outer edge, ridge, and sloped interior line. It reads the sheet in grayscale at 4 pixels per foot, where its receptive field spans a whole roof wing. Two copies are trained on different data (Sec. 4): the outline model supplies the roof region and the line model supplies ridge and sloped lines.
Merged edge classes. A first version predicted eave, rake, hip and valley separately and failed in a telling way: it never predicted rake, labelling 81% of rake pixels as eave, and confused valleys with hips. Whether an outer edge is an eave or a rake, and whether a sloped line is a hip or a valley, depends on the whole roof, not on the line's appearance. The model therefore learns outer edge and sloped line, and topology restores the distinction: a sloped line that leaves a convex outline corner is a hip, one that leaves a reflex corner is a valley, and an outer edge that a ridge meets near its middle at right angles is a rake.
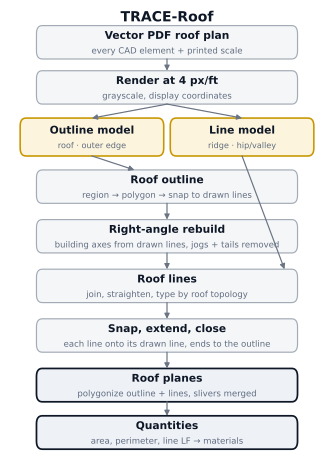
Outline. The roof region is the outline model's mask, opened by 2.5 ft, with paragraph text removed. A hatch-trained model (Sec. 3.3) replaces it only when the outline model finds under 100 SF or the hatch model finds more than six times as much roof. Each region becomes a polygon (Douglas–Peucker [9], 1 ft), each edge snaps to the outermost parallel drawn line within 1.5 ft (the eave line sits outside the dashed wall line), and corners are rebuilt where snapped edges meet.
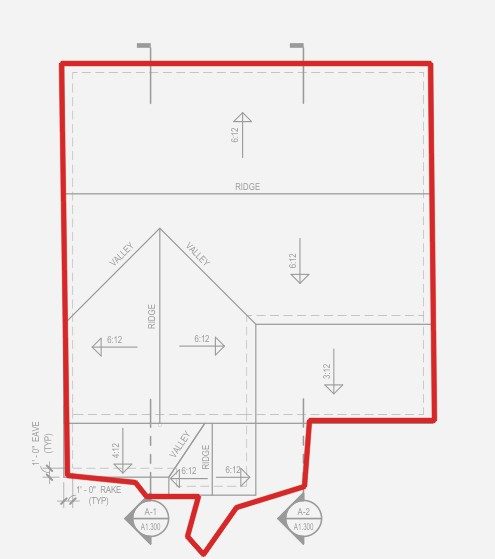
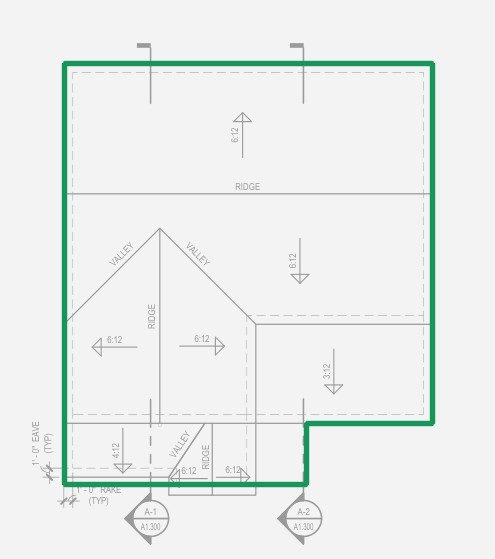
Right-angle rebuild. Building perimeters are right-angled almost everywhere, and the mask is not. The building's axes are measured from the drawn lines inside the roof (0.1° bins), every outline edge becomes horizontal or vertical in that frame, jogs under 1.5 ft merge away, small rectangular bumps whose end is not on a drawn line are cut off, and a square closing and opening remove notches and tails under about 4 ft. A polygon with a long drawn diagonal edge, a real angled wing, is left as drawn. Area guards reject any step that changes area by more than 5–8%.
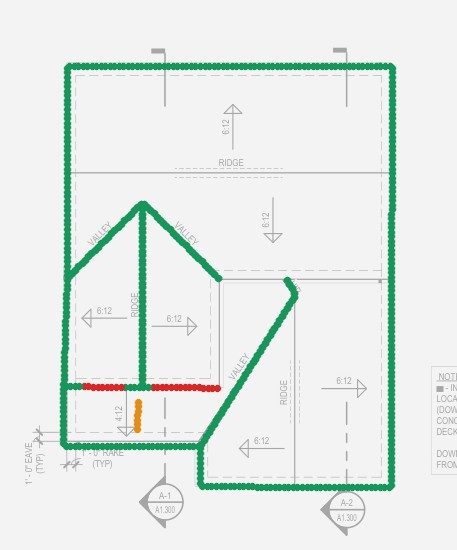
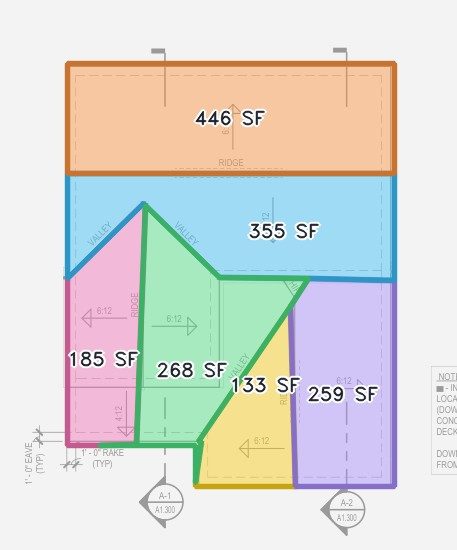
Lines and planes. Ridge and sloped pixels become segments by a probabilistic Hough transform [10]. Pieces of one line, broken where the word RIDGE or VALLEY is printed on it, are joined across gaps up to 12 ft and straightened. Each line moves onto the drawn line it follows (within 6° and 1.5 ft); its ends are pulled onto the outline or line they touch, or extended up to 6 ft (ridges to the outline); a valley pair whose feet stop short is closed along its foot. The outline and lines are then polygonized into faces; faces under 20 SF merge into a neighbour and thin protrusions are dropped.
Quantities. Plane areas sum to plan area; the outline gives perimeter; typed lines give ridge, hip and valley length. Pitch comes from callouts printed as text on the sheet.
3. Data
3.1 Training data
The field models learn from architectural roof plans drawn from Foreman AI's corpus of nearly 98,000 real engineered plans (about 3.6 million pages), together with non-roof sheets such as elevations and framing plans whose every pixel is background, so that the models learn to stay silent on drawings that are not roof plans. Each roof plan is labelled with roof planes, outer edges and interior lines in the five classes of Sec. 2.
3.2 Held-out evaluation set
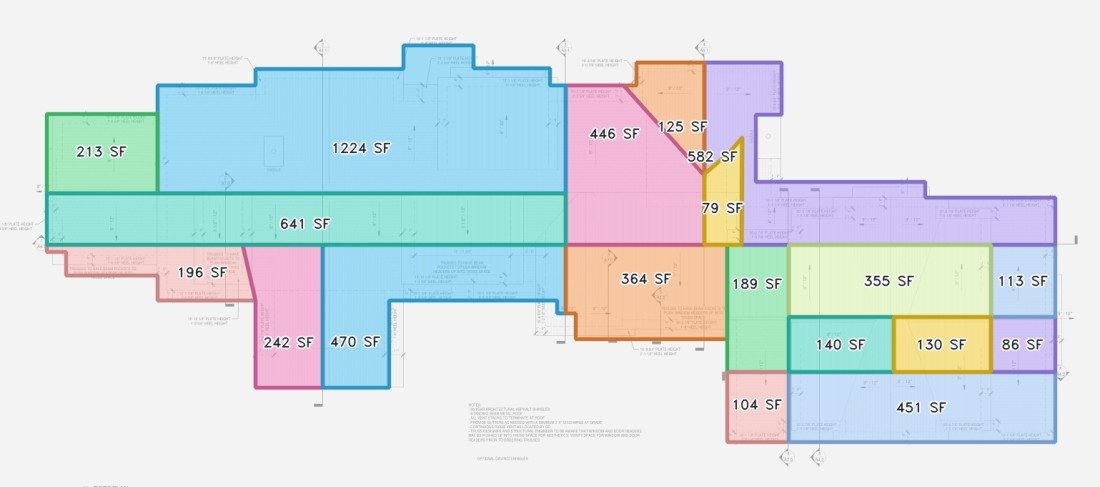
Fourteen held-out roof plans, from plan sets the models never saw, form the evaluation set (Table 1). Each is recorded plane by plane: one closed polygon per roof plane, drawn to the eave line and split at every ridge, hip and valley, with shared corners snapped together. Three of them draw the roof under dense shingle hatching or solid fill; they are reported separately throughout because they behave differently.
Builders reuse one drawing across many projects, so set-level separation is not enough. Comparing page text, we found drawings that appeared on both sides of the split and removed each duplicate from one side.
| Sheet | Scale | Kind | Planes | Reference SF | Pitch printed as text |
|---|---|---|---|---|---|
| R01 | 1/8" | ordinary | 4 | 1,775 | 6/12 |
| R02 | 1/4" | ordinary | 4 | 699 | – |
| R03 | 1/4" | ordinary | 6 | 540 | – |
| R04 | 1/4" | ordinary | 4 | 681 | – |
| R05 | 1/8" | ordinary | 6 | 1,384 | 4/12, 6/12 |
| R06 | 1/8" | ordinary | 5 | 2,582 | 6/12 |
| R07 | 3/16" | hatched / filled | 31 | 6,133 | – |
| R08 | 1/4" | hatched / filled | 19 | 8,583 | – |
| R09 | 1/8" | ordinary | 8 | 1,785 | 3/12, 4/12, 6/12 |
| R10 | 1/8" | ordinary | 5 | 2,597 | 6/12 |
| R11 | 1/8" | ordinary | 13 | 2,063 | 3/12, 5/12, 6/12 |
| R12 | 1/4" | hatched / filled | 12 | 3,022 | – |
| R13 | 1/8" | ordinary | 7 | 1,624 | 4/12, 6/12 |
| R14 | 1/8" | ordinary | 11 | 2,421 | 4/12, 5/12, 6/12, 8/12 |
| Total (14 sheets) | 11 + 3 | 135 | 35,889 | 8 sheets |
3.3 A negative result: teaching hatch by painting it
Few roof plans in the training data are drawn with shingle hatching, so we painted synthetic roof patterns (parallel seams, staggered shingle courses, gray fill) onto roof planes during training. The model learned that pattern means roof: area on clean sheets rose by 100–388%. Painting the same patterns onto closed non-roof shapes as well (two-sided augmentation) reduced but did not remove the over-painting. That model is kept only as the fallback of Sec. 2, consulted when the outline model sees almost nothing.
4. Method
4.1 Training
Both models use one recipe: random 384-pixel crops at 4 px/ft, full eight-fold rotation and flip symmetry (plan views have no gravity), class-weighted cross-entropy plus Dice on the edge and roof unions, and AdamW [4] with warm-up and cosine decay. Part of each batch comes from non-roof sheets, and most roof crops are centred on a pixel of a randomly chosen edge class; blank paper is background. The outline model trains on architectural roof plans. The line model is trained from scratch on a broader set that adds more architectural roofs with complex hip and valley geometry.
4.2 Evaluation
All scores use the 14 held-out sheets, with ordinary (11) and hatched (3) roofs reported separately.
Area. Error of the predicted plan area against the union of the reference planes.
Lines. Because every plane is recorded separately, the edges two planes share are the interior roof lines and the edges no other plane shares are the outer edge. Reference lines are typed by the same rules the system uses; edges the rules leave untyped are excluded and predictions on them are not penalised. Both line sets are sampled every 0.5 ft and, in the spirit of buffer-based positional accuracy [11], with ℓ(·) length and Nd(·) the neighbourhood at d = 1.5 ft:
per class, pooled over sheets by length.
Planes. A reference plane is found when one predicted plane overlaps it with intersection over union of at least 0.6. Plane recovery is the share of reference roof area whose plane was found, which weights a 1,000 SF main plane above a 20 SF strip, as a takeoff does.
5. Results
5.1 Roof area
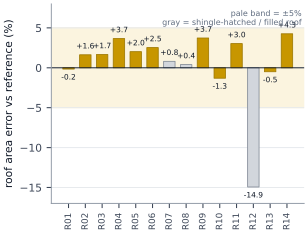
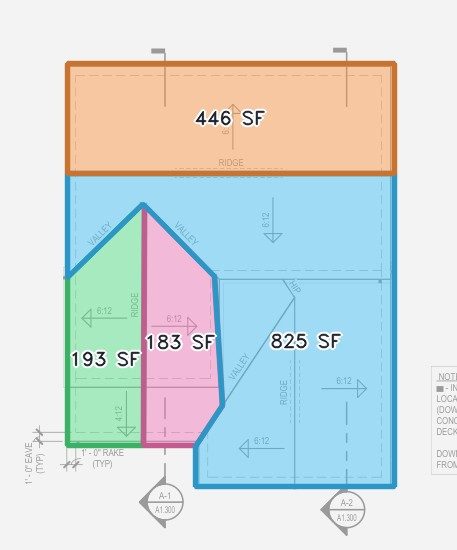
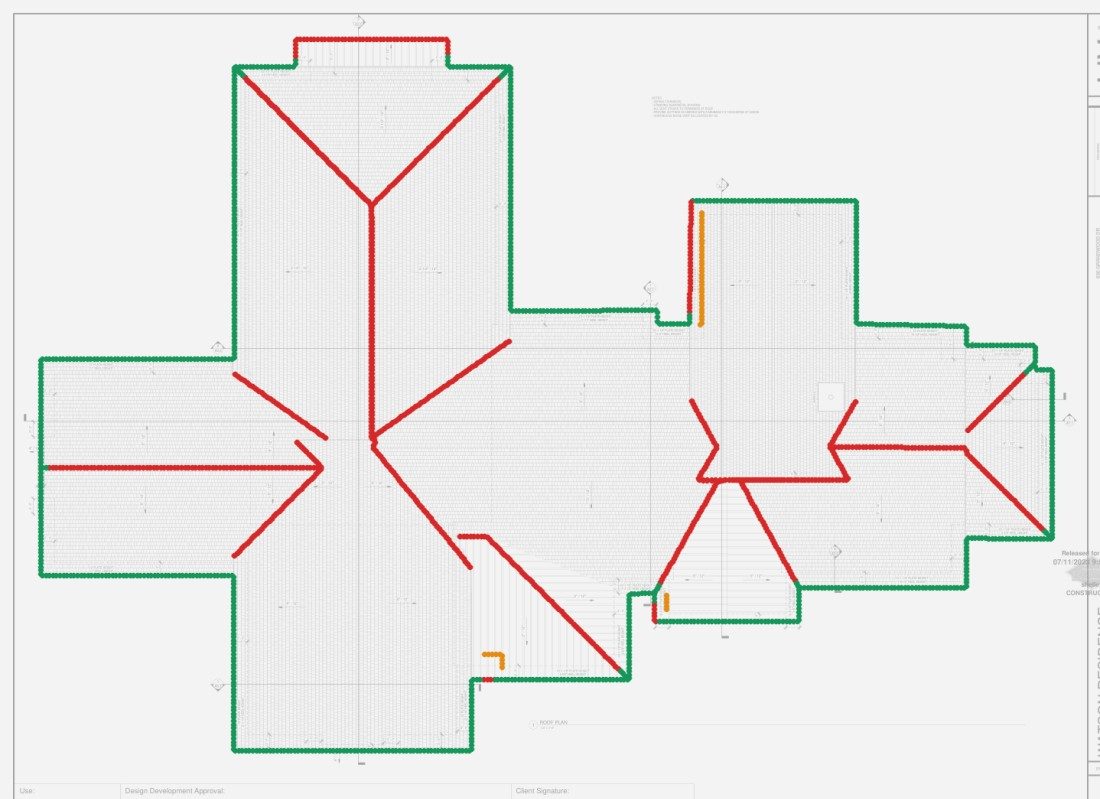
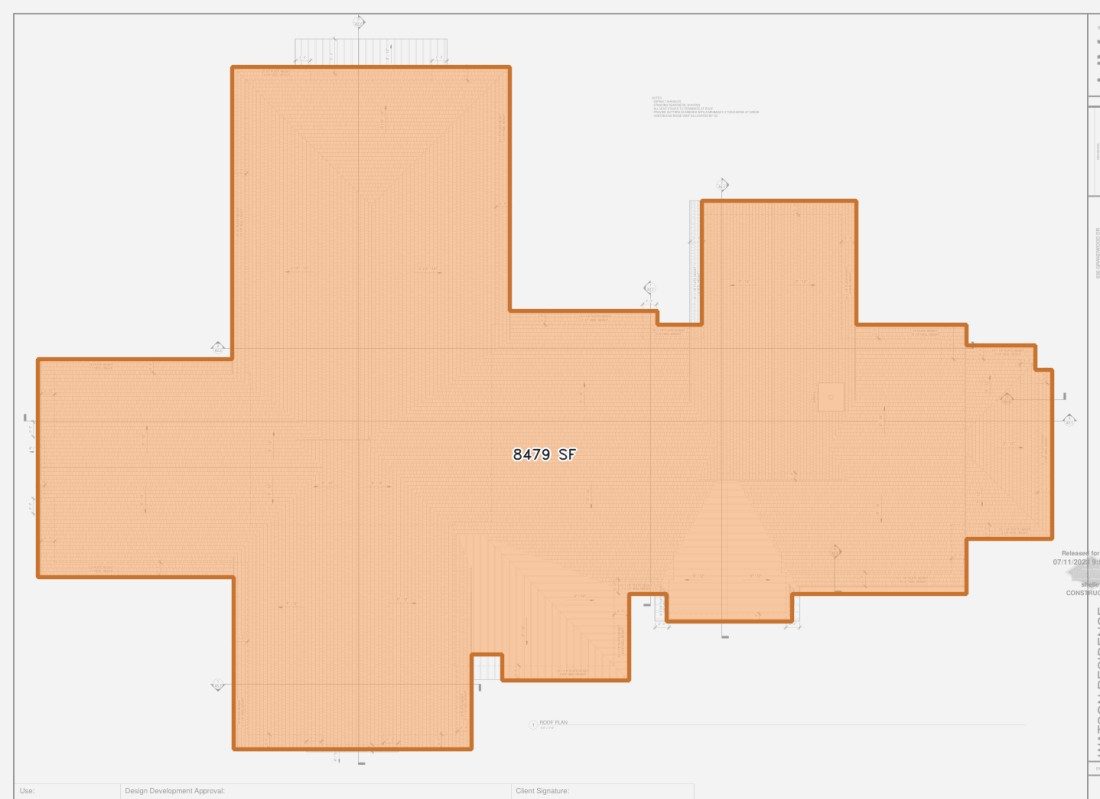
Area is already takeoff-grade on ordinary roofs (Table 2, Fig. 3). The median absolute error over all 14 sheets is 1.8%; 13 of 14 are within 5%, and every ordinary roof is within 4.3%. Two of the three hatched roofs are within 1% through the hatch-trained fallback. The outlier is R12, a roof drawn as solid gray fill, where the region misses a wing and area is 14.9% low. The right-angle rebuild leaves the median essentially unchanged (1.8%) while removing the visible defects of Fig. 4: on R09 it moves area from 1,852 to 1,816 SF against 1,785 in the reference.
5.2 Roof lines
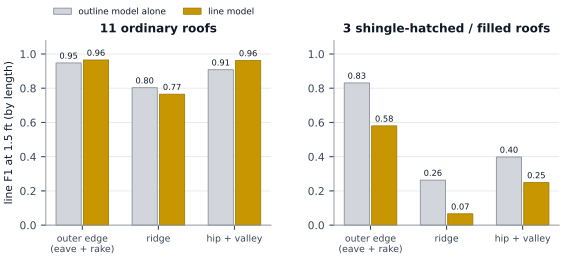
On ordinary roofs the outline model already finds the roof edge (F1 0.95), ridges (0.80) and hips and valleys (0.91) at high precision (Table 3, Fig. 5). The line model raises outer-edge F1 to 0.96 and hip/valley F1 to 0.96, the latter with recall rising from 0.83 to 0.95, while ridge F1 falls about four points to 0.77. The ridges both models miss are mostly short gable ridges with the word RIDGE printed along them, and ridges that end where a lower roof meets a wall.
On hatched roofs the picture reverses. The outline model barely sees these roofs; it scores 0.83 on outer edge only because the hatch-trained fallback takes over and finds the roof edge; ridge and hip/valley F1 are 0.26 and 0.40. The line model paints at least part of two of the three, which disables the fallback, and drops to 0.58, 0.07 and 0.25.
| Lines from | Sheets | Outer edge F1 (P / R) | Ridge F1 (P / R) | Hip + valley F1 (P / R) |
|---|---|---|---|---|
| Outline model alone | 11 ordinary | 0.95 (1.00 / 0.90) | 0.80 (0.82 / 0.79) | 0.91 (0.99 / 0.83) |
| Outline model alone | 3 hatched | 0.83 (0.92 / 0.76) | 0.26 (0.21 / 0.35) | 0.40 (0.94 / 0.25) |
| Line model | 11 ordinary | 0.96 (0.98 / 0.95) | 0.77 (0.79 / 0.74) | 0.96 (0.97 / 0.95) |
| Line model | 3 hatched | 0.58 (0.96 / 0.42) | 0.07 (0.07 / 0.06) | 0.25 (0.87 / 0.14) |
5.3 Roof planes
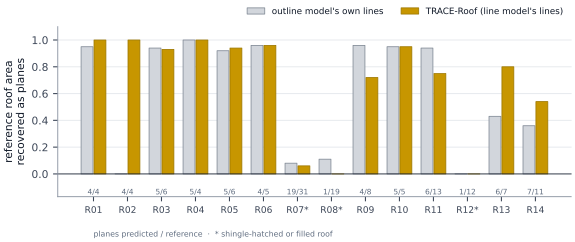
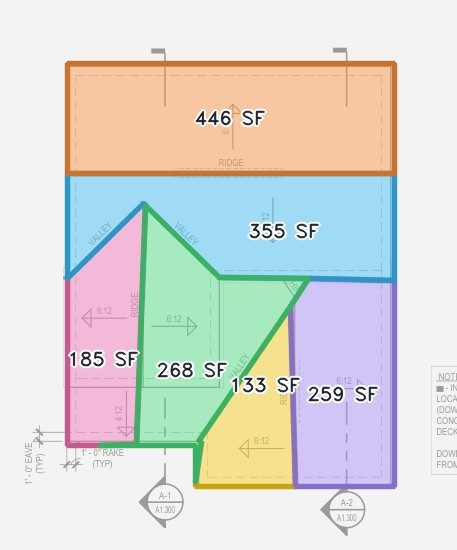
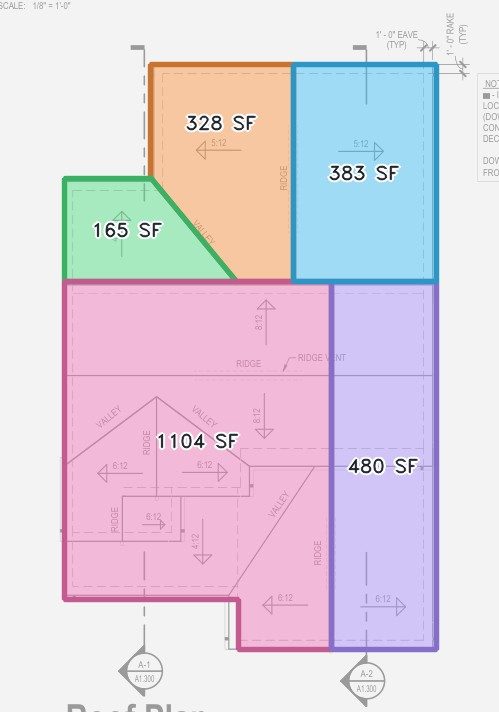
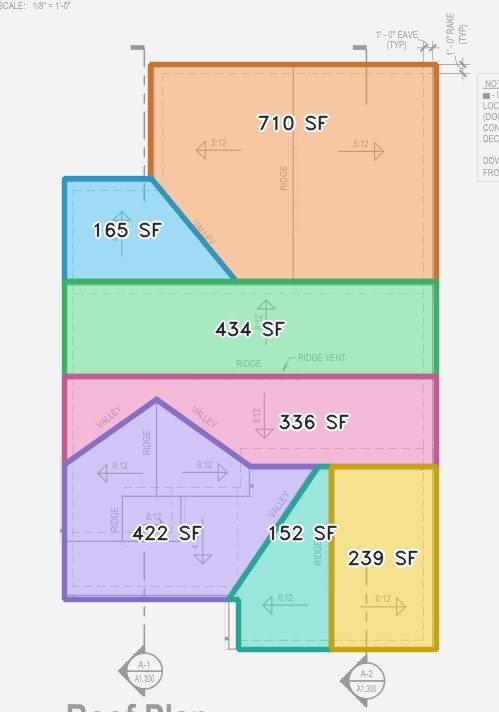
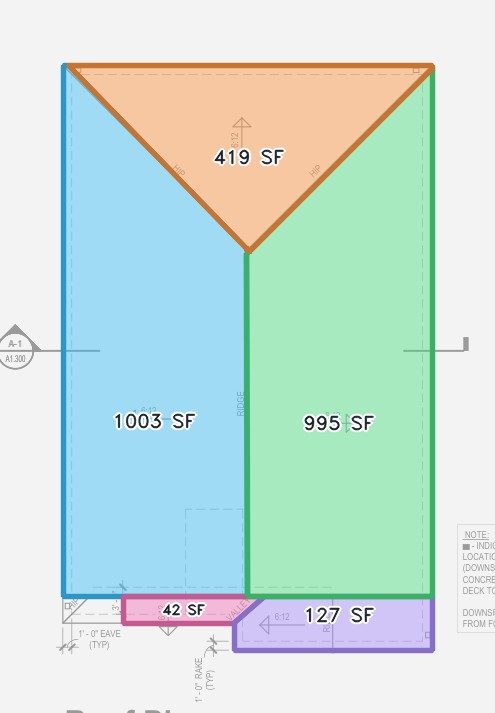
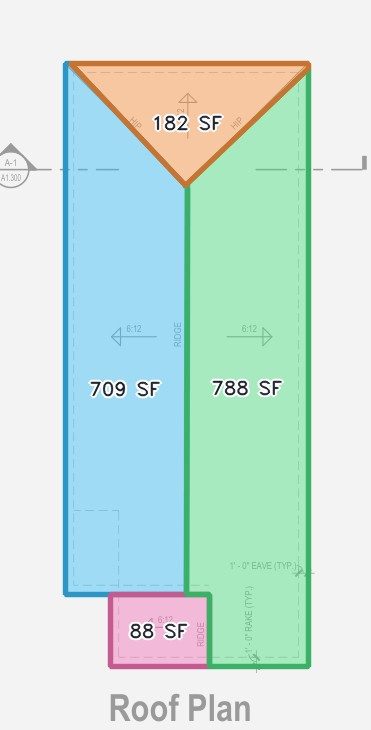
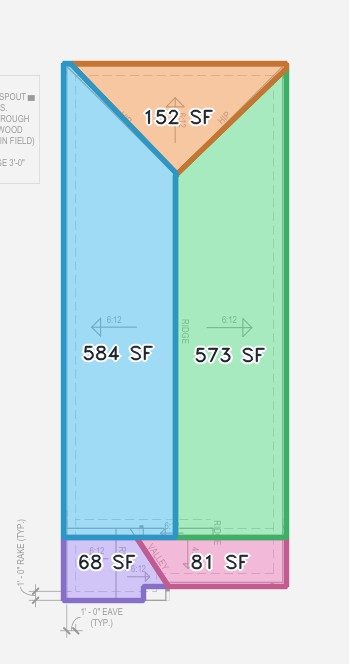
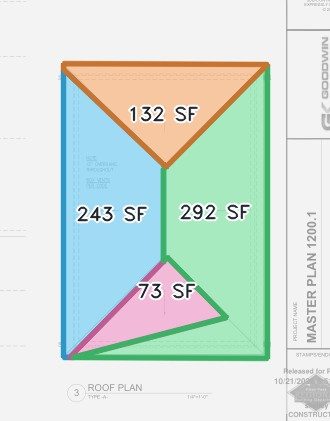
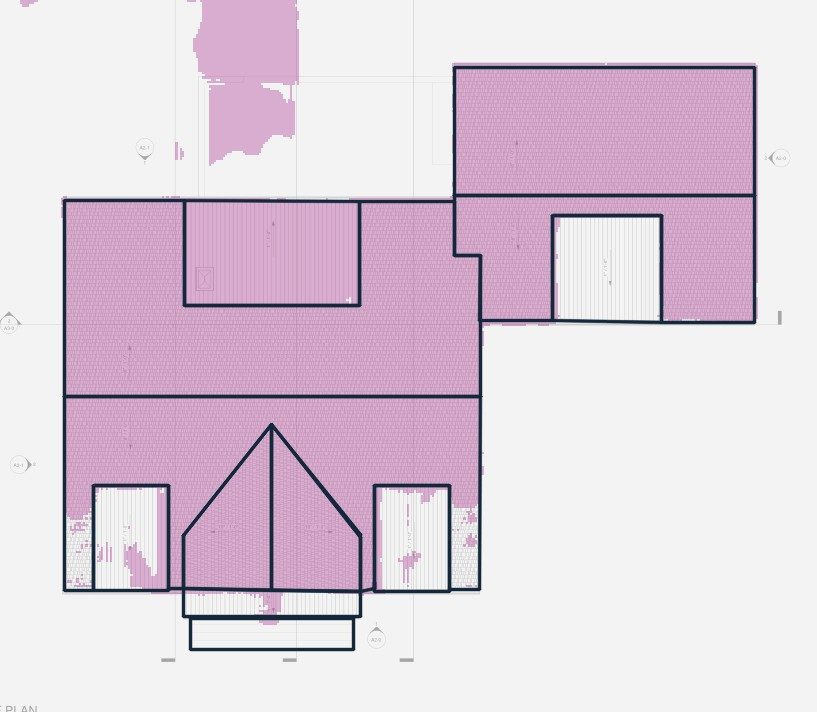
Planes are the strictest test: one missed line merges two planes, one false line splits one. Built from the outline model's own lines, planes recover 78.9% of reference roof area on ordinary roofs. Built from the line model's lines inside the outline model's outline — the configuration we call TRACE-Roof — they recover 84.5%; the line model alone, with its own outline, recovers 84.0% (Fig. 6). Seven of the 11 ordinary roofs reach 0.93 or better; hip roofs come out with each hip end a single triangle and the main planes split exactly on the ridge (Fig. 8). The largest gains are on roofs with gable wings, where the line model's valleys close the wing (R13, Fig. 7). On hatched roofs plane recovery stays below 0.1 for every configuration.
Two cleanup stages matter as much as the models. Before ends that already touched another line were pulled onto it rather than extended, ridges ran on across hip ends and split them in two; before collinear pieces were joined across printed labels, R14's main ridge failed to close its planes and its recovery fell from 0.54 to 0.23.
| Sheet | Reference SF | Outline SF | Error | Planes SF | Error | Planes / reference | Plane recovery |
|---|---|---|---|---|---|---|---|
| R01 | 1,775 | 1,772 | -0.2% | 1,767 | -0.4% | 4 / 4 | 1.00 |
| R02 | 699 | 711 | +1.6% | 740 | +5.9% | 4 / 4 | 1.00 |
| R03 | 540 | 549 | +1.7% | 554 | +2.5% | 5 / 6 | 0.93 |
| R04 | 681 | 706 | +3.7% | 707 | +3.9% | 5 / 4 | 1.00 |
| R05 | 1,384 | 1,412 | +2.0% | 1,457 | +5.2% | 5 / 6 | 0.94 |
| R06 | 2,582 | 2,647 | +2.5% | 2,630 | +1.9% | 4 / 5 | 0.96 |
| R07 | 6,133 | 6,183 | +0.8% | 6,149 | +0.3% | 19 / 31 | 0.06 |
| R08 | 8,583 | 8,618 | +0.4% | 8,479 | -1.2% | 1 / 19 | 0.00 |
| R09 | 1,785 | 1,852 | +3.7% | 1,816 | +1.7% | 4 / 8 | 0.72 |
| R10 | 2,597 | 2,563 | -1.3% | 2,586 | -0.4% | 5 / 5 | 0.95 |
| R11 | 2,063 | 2,126 | +3.0% | 2,135 | +3.5% | 6 / 13 | 0.75 |
| R12 | 3,022 | 2,570 | -14.9% | 2,592 | -14.2% | 1 / 12 | 0.00 |
| R13 | 1,624 | 1,616 | -0.5% | 1,647 | +1.4% | 6 / 7 | 0.80 |
| R14 | 2,421 | 2,524 | +4.3% | 2,460 | +1.6% | 7 / 11 | 0.54 |
5.4 A negative result: fine-tuning the outline model
The obvious alternative to a second model is to fine-tune the outline model on the additional architectural and hatched roofs. No fine-tuned variant beat the base model on ridges (the best tied it at 0.79 against 0.80), and every variant that pushed harder lost hatched roofs, with hatched outer-edge F1 falling as low as 0.53. Training from scratch on the broader set instead, which gives the line model of Sec. 4, produced the best hip/valley F1 (0.96) and plane recovery, at the cost of the worst hatched results. A model that learns enough to see part of a hatched roof, but not all of it, does worse than one that sees none, because a partial region disables the fallback.
5.5 A worked takeoff
Table 4 multiplies out R10, a hip roof with 6/12 printed on the sheet. Plan area differs from the reference by 11 SF and perimeter by less than 1 LF, so every area- and perimeter-driven material lands on the same order quantity: 100 sheets of decking, 32.4 squares of shingles (98 bundles), 223 LF of drip edge. Line-driven materials (ridge and hip cap, valley metal) are not yet reported as takeoff quantities; Sec. 5.2 gives their accuracy.
| Material | Unit | From reference | From TRACE-Roof |
|---|---|---|---|
| Plan area | SF | 2,597 | 2,586 |
| Sloped area at 6/12 (× 1.118) | SF | 2,904 | 2,891 |
| Roof decking, 7/16" OSB (+10%) | sheets | 100 | 100 |
| Synthetic underlayment (+10%) | squares | 31.9 | 31.8 |
| Shingles (+12% waste) | squares | 32.5 | 32.4 |
| Shingle bundles (3 per square) | bundles | 98 | 98 |
| Drip edge, full perimeter (+5% laps) | LF | 223 | 223 |
| Fascia | LF | 212 | 212 |
| Attic ventilation, 1/300 rule | sq in NFA | 1,247 | 1,241 |
6. Failure analysis
6.1 Hatched and filled roofs
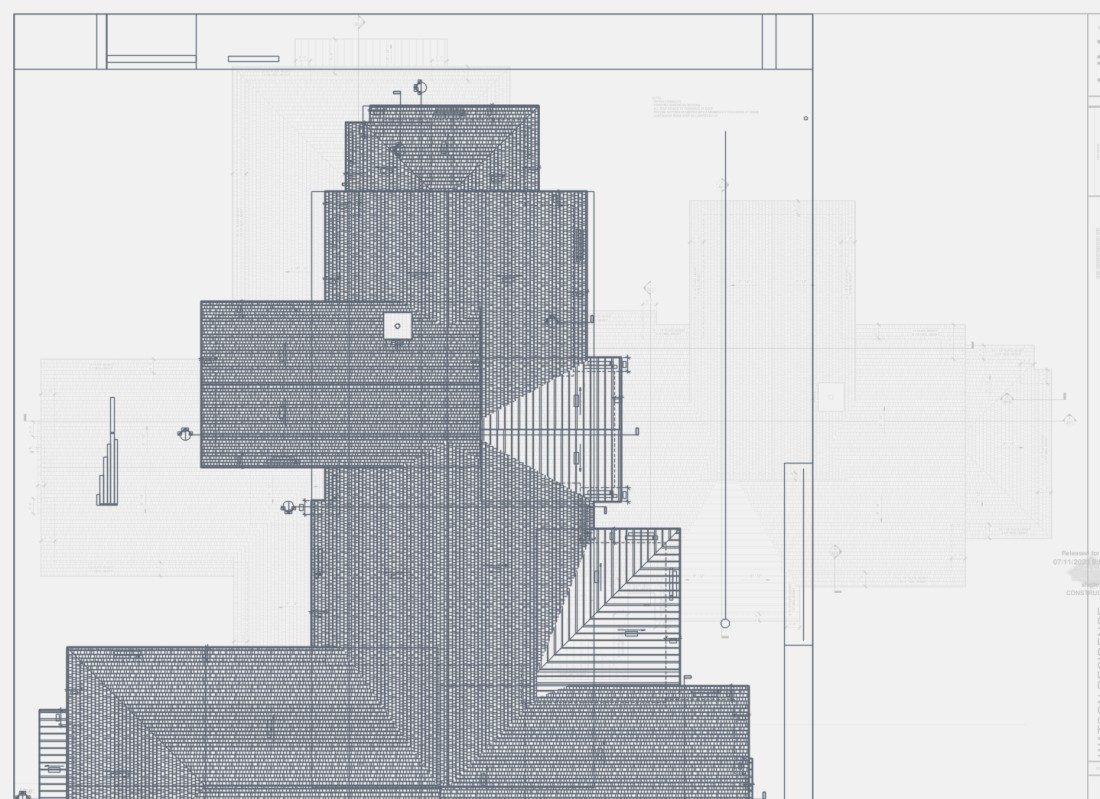
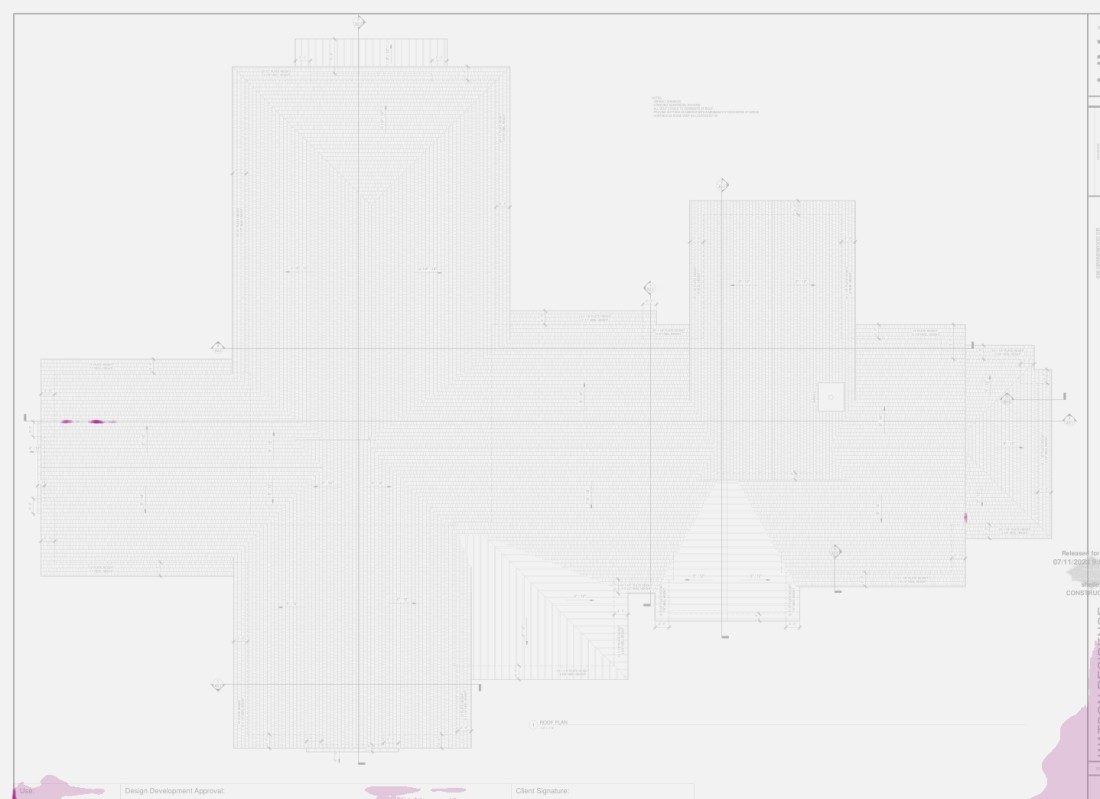
Figure 9 shows the failure in full. R08 draws a 19-plane roof under thousands of short shingle strokes (Fig. 9a). Neither learned model paints it (Fig. 9b); the hatch-trained fallback supplies a region whose snapped, right-angled outline is within 1.2% of the reference area, but no interior line survives, so the roof is one plane and 38.1% of reference line length is found. R07 is the same failure on a 31-plane roof, and R12, a solid gray fill, fails at the region itself (Fig. 10). This is a data problem in the plainest sense: the training data rarely shows these drawings, and the hatched examples added so far were not enough.
6.2 Missing ridges
On ordinary roofs nearly every remaining error is a missing interior line, and a missing line costs a whole plane. R14 recovers 7 of 11 planes: its smaller roofs at the bottom of the sheet lack their own ridges, so they merge with their neighbours although the outline and the main ridge are right (92.8% of reference line length found). Two patterns account for most misses: short gable ridges with RIDGE printed along them, and lines where a lower roof meets a wall or eave, which are steps rather than ridges and which our rules deliberately leave untyped.
7. Discussion
Area is ready; lines need data. On ordinary roofs TRACE-Roof measures plan area within a few percent and perimeter almost exactly, which already covers decking, underlayment, shingles, drip edge and fascia. Lines are accurate where the model finds them, and precision stays high throughout; the losses are recall, which is what more examples of the missed patterns should fix.
The geometry stages carried more of the result than the models did. Snapping to drawn lines, the right-angle rebuild, joining lines across their printed labels and closing valley pairs each fixed a visible class of error without retraining, and each is a rule about drawings that holds across drafting styles — the opposite of the drafting-style rules that sank the earlier module. The division of labour is the one TRACE uses for walls [1]: the model decides what a line is; the drawing decides where it is.
Fine-tuning failed for roofs where it succeeded for commercial walls [2], and the difference is instructive. Commercial walls added a new drawing style to a task the model already did; hatched roofs ask the model to see through a texture it was trained to treat as noise, and a partial answer is worse than none because it disables the fallback. Two models, or one model that routes hatched roofs explicitly, are the practical answer until hatched examples are far more plentiful.
8. Limitations and threats to validity
- Small test set. Fourteen sheets, three of them hatched, detect large effects but cannot rank close variants; plane recovery on one sheet moves by tenths.
- Selection on the test set. The model combination, the hatch-fallback ratio and the geometry thresholds were developed while inspecting the held-out sheets. The reported numbers are therefore optimistic; a fresh test set scored once is the next step.
- Shared rules. Reference lines are typed by the same topology rules the system uses, so typing errors the rules make are invisible to the line metric. Untyped edges (steps, odd angles) are excluded from scoring, which favours recall.
- One set of conventions. The reference set follows a single set of drawing conventions (where the eave line sits, where planes split), and those conventions are the benchmark's conventions.
- Scale and pitch from text. Scale comes from the printed scale nearest the roof plan; a wrong scale scales every measurement. Pitch callouts are found as text on 8 of 14 sheets, and a single pitch per roof is assumed.
- Not in production. TRACE-Roof runs offline on held-out sheets; it is not yet wired into the estimating product.
9. Reproducibility
The held-out reference set, the trainer, the plane builder, the three scorers and the scripts that regenerate every figure and number in this paper are retained by Foreman AI Research with checkpoint hashes for the outline model, the line model and the hatch fallback. Every number is computed from saved model outputs by the current geometry code.
10. Conclusion
A compact roof field model plus geometry that trusts the drawing recovers roof area within a few percent on ordinary roof plans, perimeter almost exactly, and 84.5% of roof area as correct planes, in exact PDF coordinates and without reading a single pitch arrow or title the old rules depended on. The pilot also locates the remaining work precisely: interior lines on hatched and filled roofs, and the short ridges that decide whether a small roof is its own plane. The next steps are more examples of hatched and complex roofs, a hatched-roof route that does not depend on a fallback, a per-plane pitch reader, and a fresh test set scored once.
Data availability
The plan sheets come from Foreman AI's proprietary corpus and are not redistributed; sheets are identified by neutral IDs. Aggregate results, per-sheet scores and checkpoint hashes are retained by Foreman AI Research.
Competing interests
Kyle Rossignol is the founder of Foreman AI LLC, which develops commercial construction-estimating software incorporating the technology described here. This manuscript reports internal research and should be interpreted with that relationship disclosed.
Funding
The work was conducted as internal research and development by Foreman AI LLC. No external funding was received.
Author contributions
K.R. conceived the project and directed the experiments. Model training, evaluation, the geometry stages and drafting of this manuscript were carried out with Claude (Anthropic), an AI model, under K.R.'s direction.
References
- K. Rossignol, “TRACE Residential: Candidate-Then-Verify Wall Recovery from Vector Construction Drawings,” Foreman AI Research, TRACE Series Report 1, Colorado, USA, Sep. 2026.
- K. Rossignol, “TRACE Commercial: Adapting Wall Recovery to Commercial Floor Plans,” Foreman AI Research, TRACE Series Report 2, Colorado, USA, Sep. 2026.
- O. Ronneberger, P. Fischer, and T. Brox, “U-Net: Convolutional Networks for Biomedical Image Segmentation,” in Medical Image Computing and Computer-Assisted Intervention (MICCAI), pp. 234–241, 2015.
- I. Loshchilov and F. Hutter, “Decoupled Weight Decay Regularization,” in International Conference on Learning Representations (ICLR), 2019.
- C. Liu, J. Wu, P. Kohli, and Y. Furukawa, “Raster-To-Vector: Revisiting Floorplan Transformation,” in Proc. IEEE International Conference on Computer Vision (ICCV), pp. 2195–2203, 2017.
- A. Kalervo, J. Ylioinas, M. Häikiö, A. Karhu, and J. Kannala, “CubiCasa5K: A Dataset and an Improved Multi-Task Model for Floorplan Image Analysis,” arXiv:1904.01920, 2019.
- W. Song, M. M. Abyaneh, M. A. A. Shabani, and Y. Furukawa, “Vectorizing Building Blueprints,” in Proc. Asian Conference on Computer Vision (ACCV), pp. 1044–1059, 2022.
- V. Verma, R. Kumar, and S. Hsu, “3D Building Detection and Modeling from Aerial LIDAR Data,” in Proc. IEEE Conference on Computer Vision and Pattern Recognition (CVPR), pp. 2213–2220, 2006.
- D. H. Douglas and T. K. Peucker, “Algorithms for the reduction of the number of points required to represent a digitized line or its caricature,” Cartographica, vol. 10, no. 2, pp. 112–122, 1973.
- J. Matas, C. Galambos, and J. Kittler, “Robust Detection of Lines Using the Progressive Probabilistic Hough Transform,” Computer Vision and Image Understanding, vol. 78, no. 1, pp. 119–137, 2000.
- M. F. Goodchild and G. J. Hunter, “A simple positional accuracy measure for linear features,” International Journal of Geographical Information Science, vol. 11, no. 3, pp. 299–306, 1997.